Documentation metrics dashboard

Problem
Docs teams are asked whether things are getting better, and usually answer from gut feel. MDN Web Docs runs its content in the open on GitHub, so the answer can be measured.
What I built
A resumable pipeline that pulls MDN's issues, pull requests, and comments into SQLite. Written definitions for six metrics, each one a tested SQL query, shown in an interactive dashboard.
Result
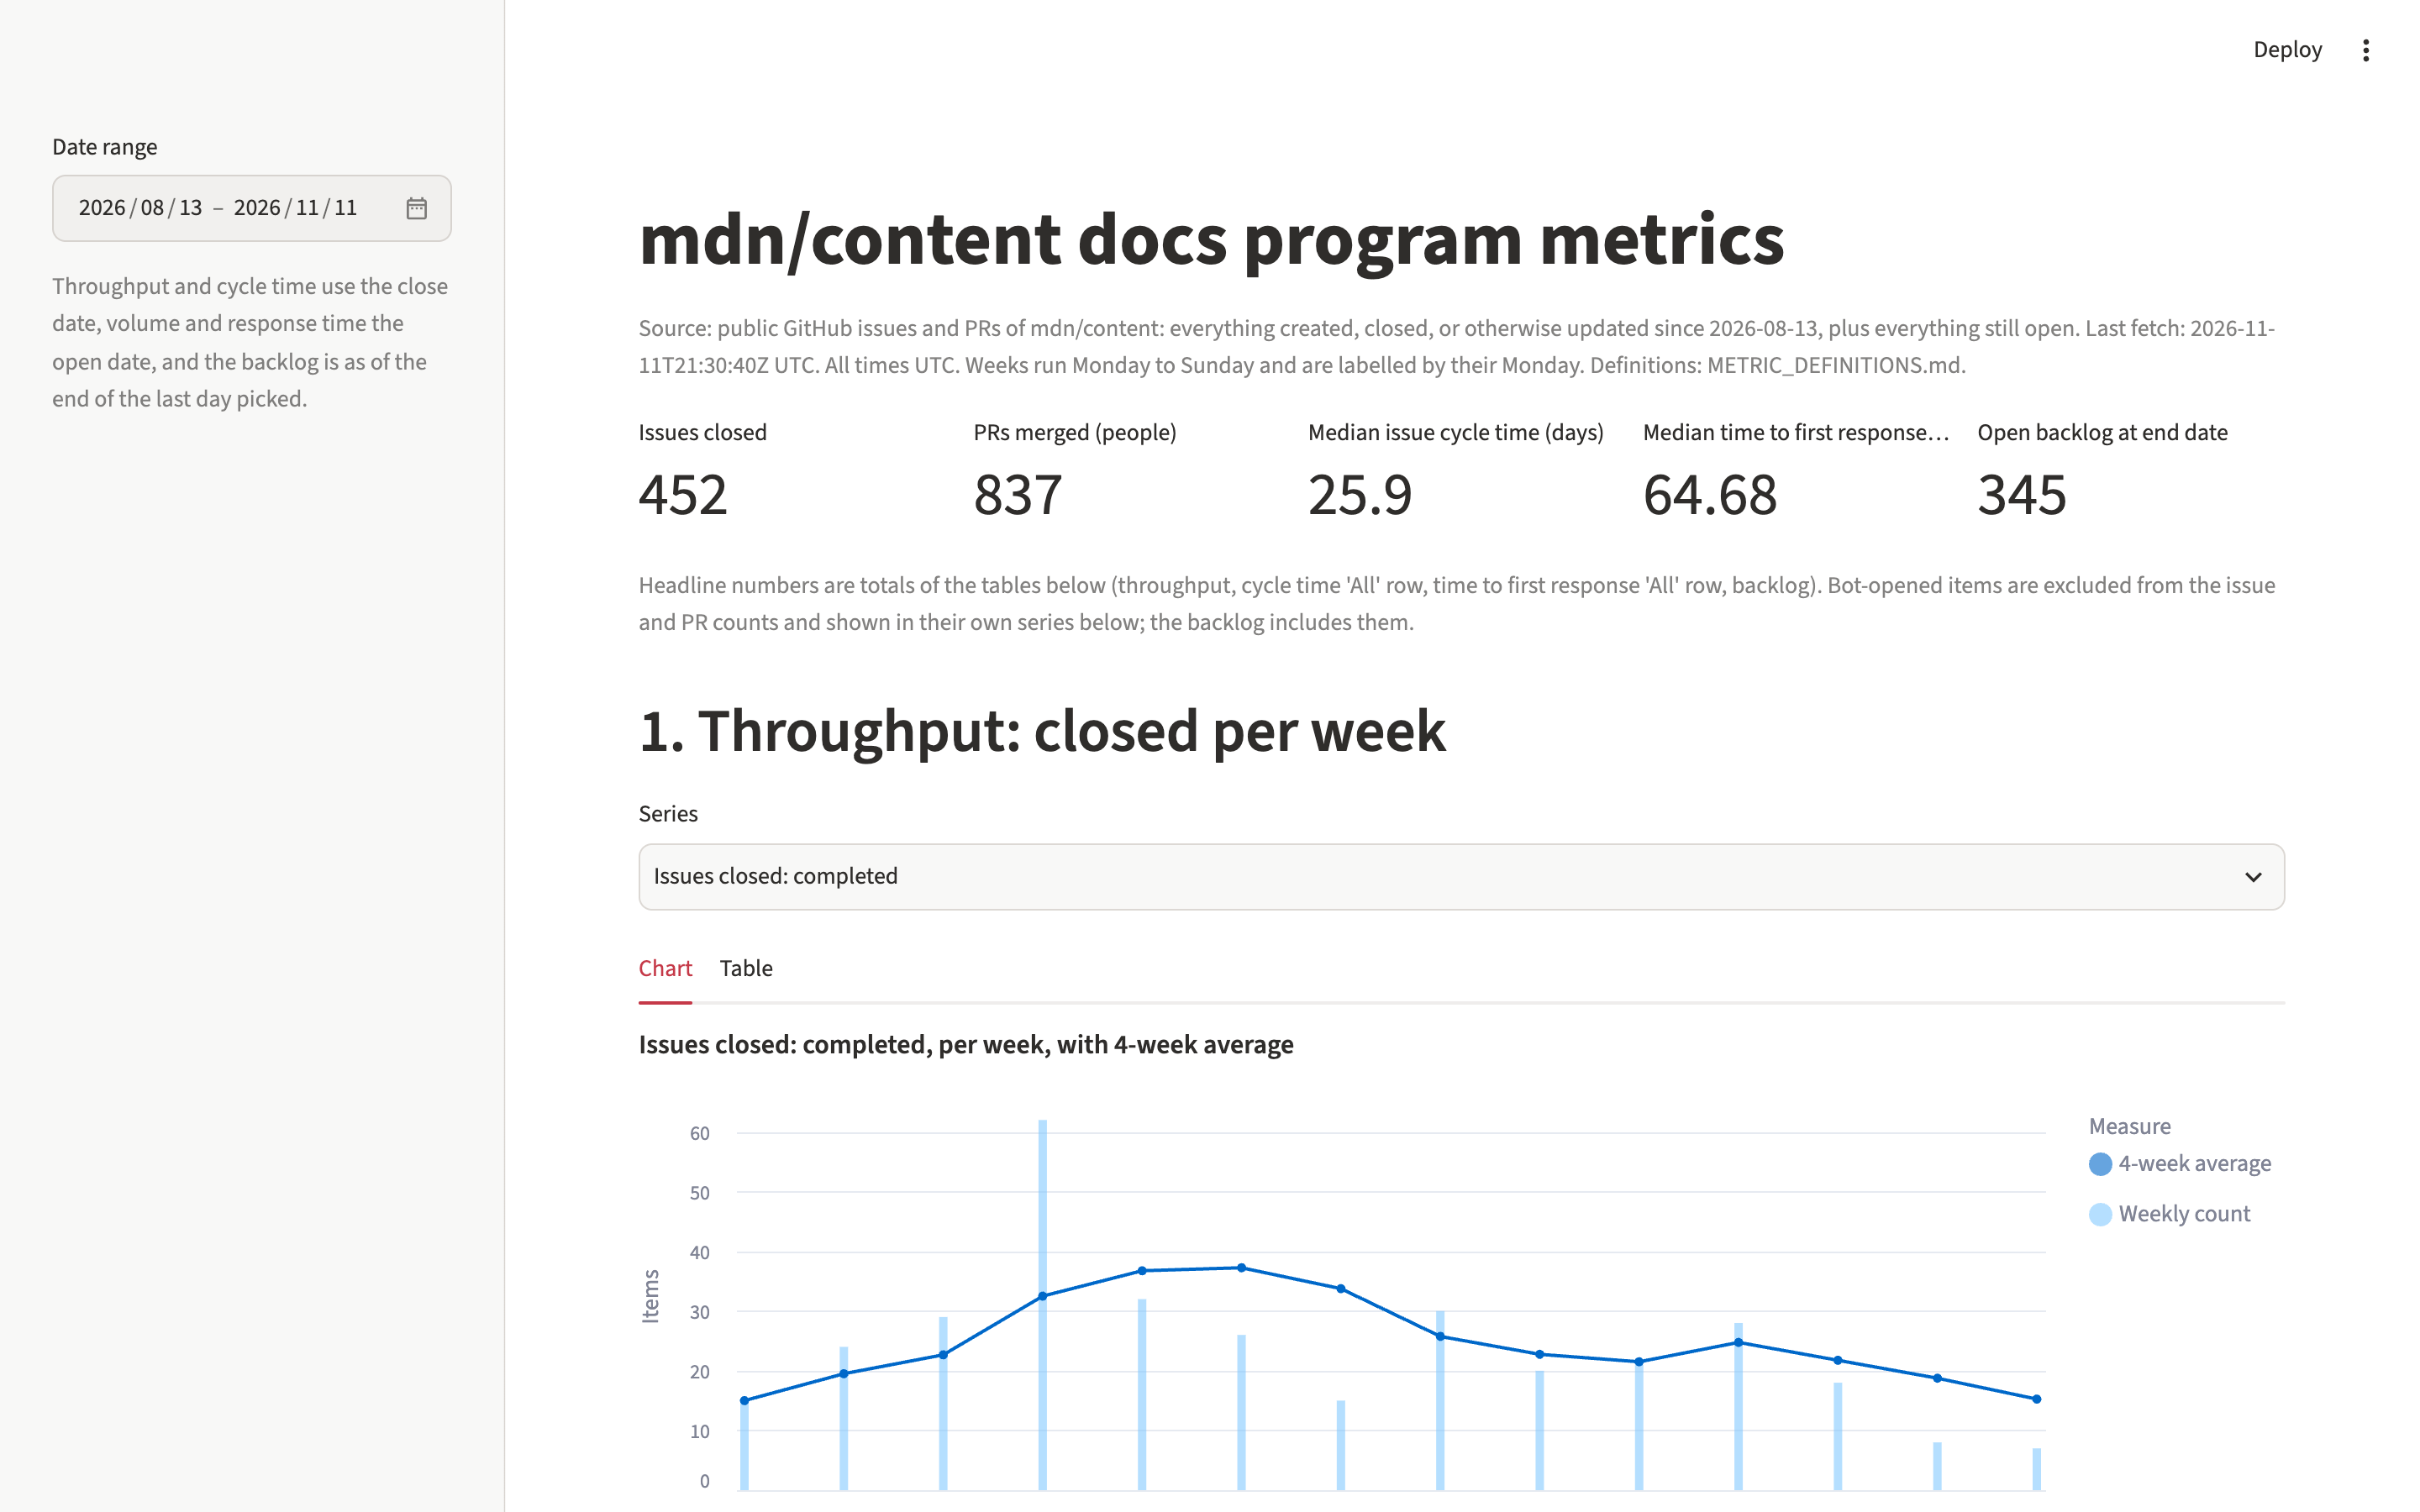
Over 90 days: 452 issues closed, 837 PRs merged by people, a median of 26 days from issue to close, and 65 hours to a first human reply. Every number traces back to a named query.

A closer look

Top of the dashboard: a date range picker, the data source and fetch time, five headline numbers, and the start of the throughput chart.
Headline numbers for the 90 days, with the data source and fetch time stated above them.
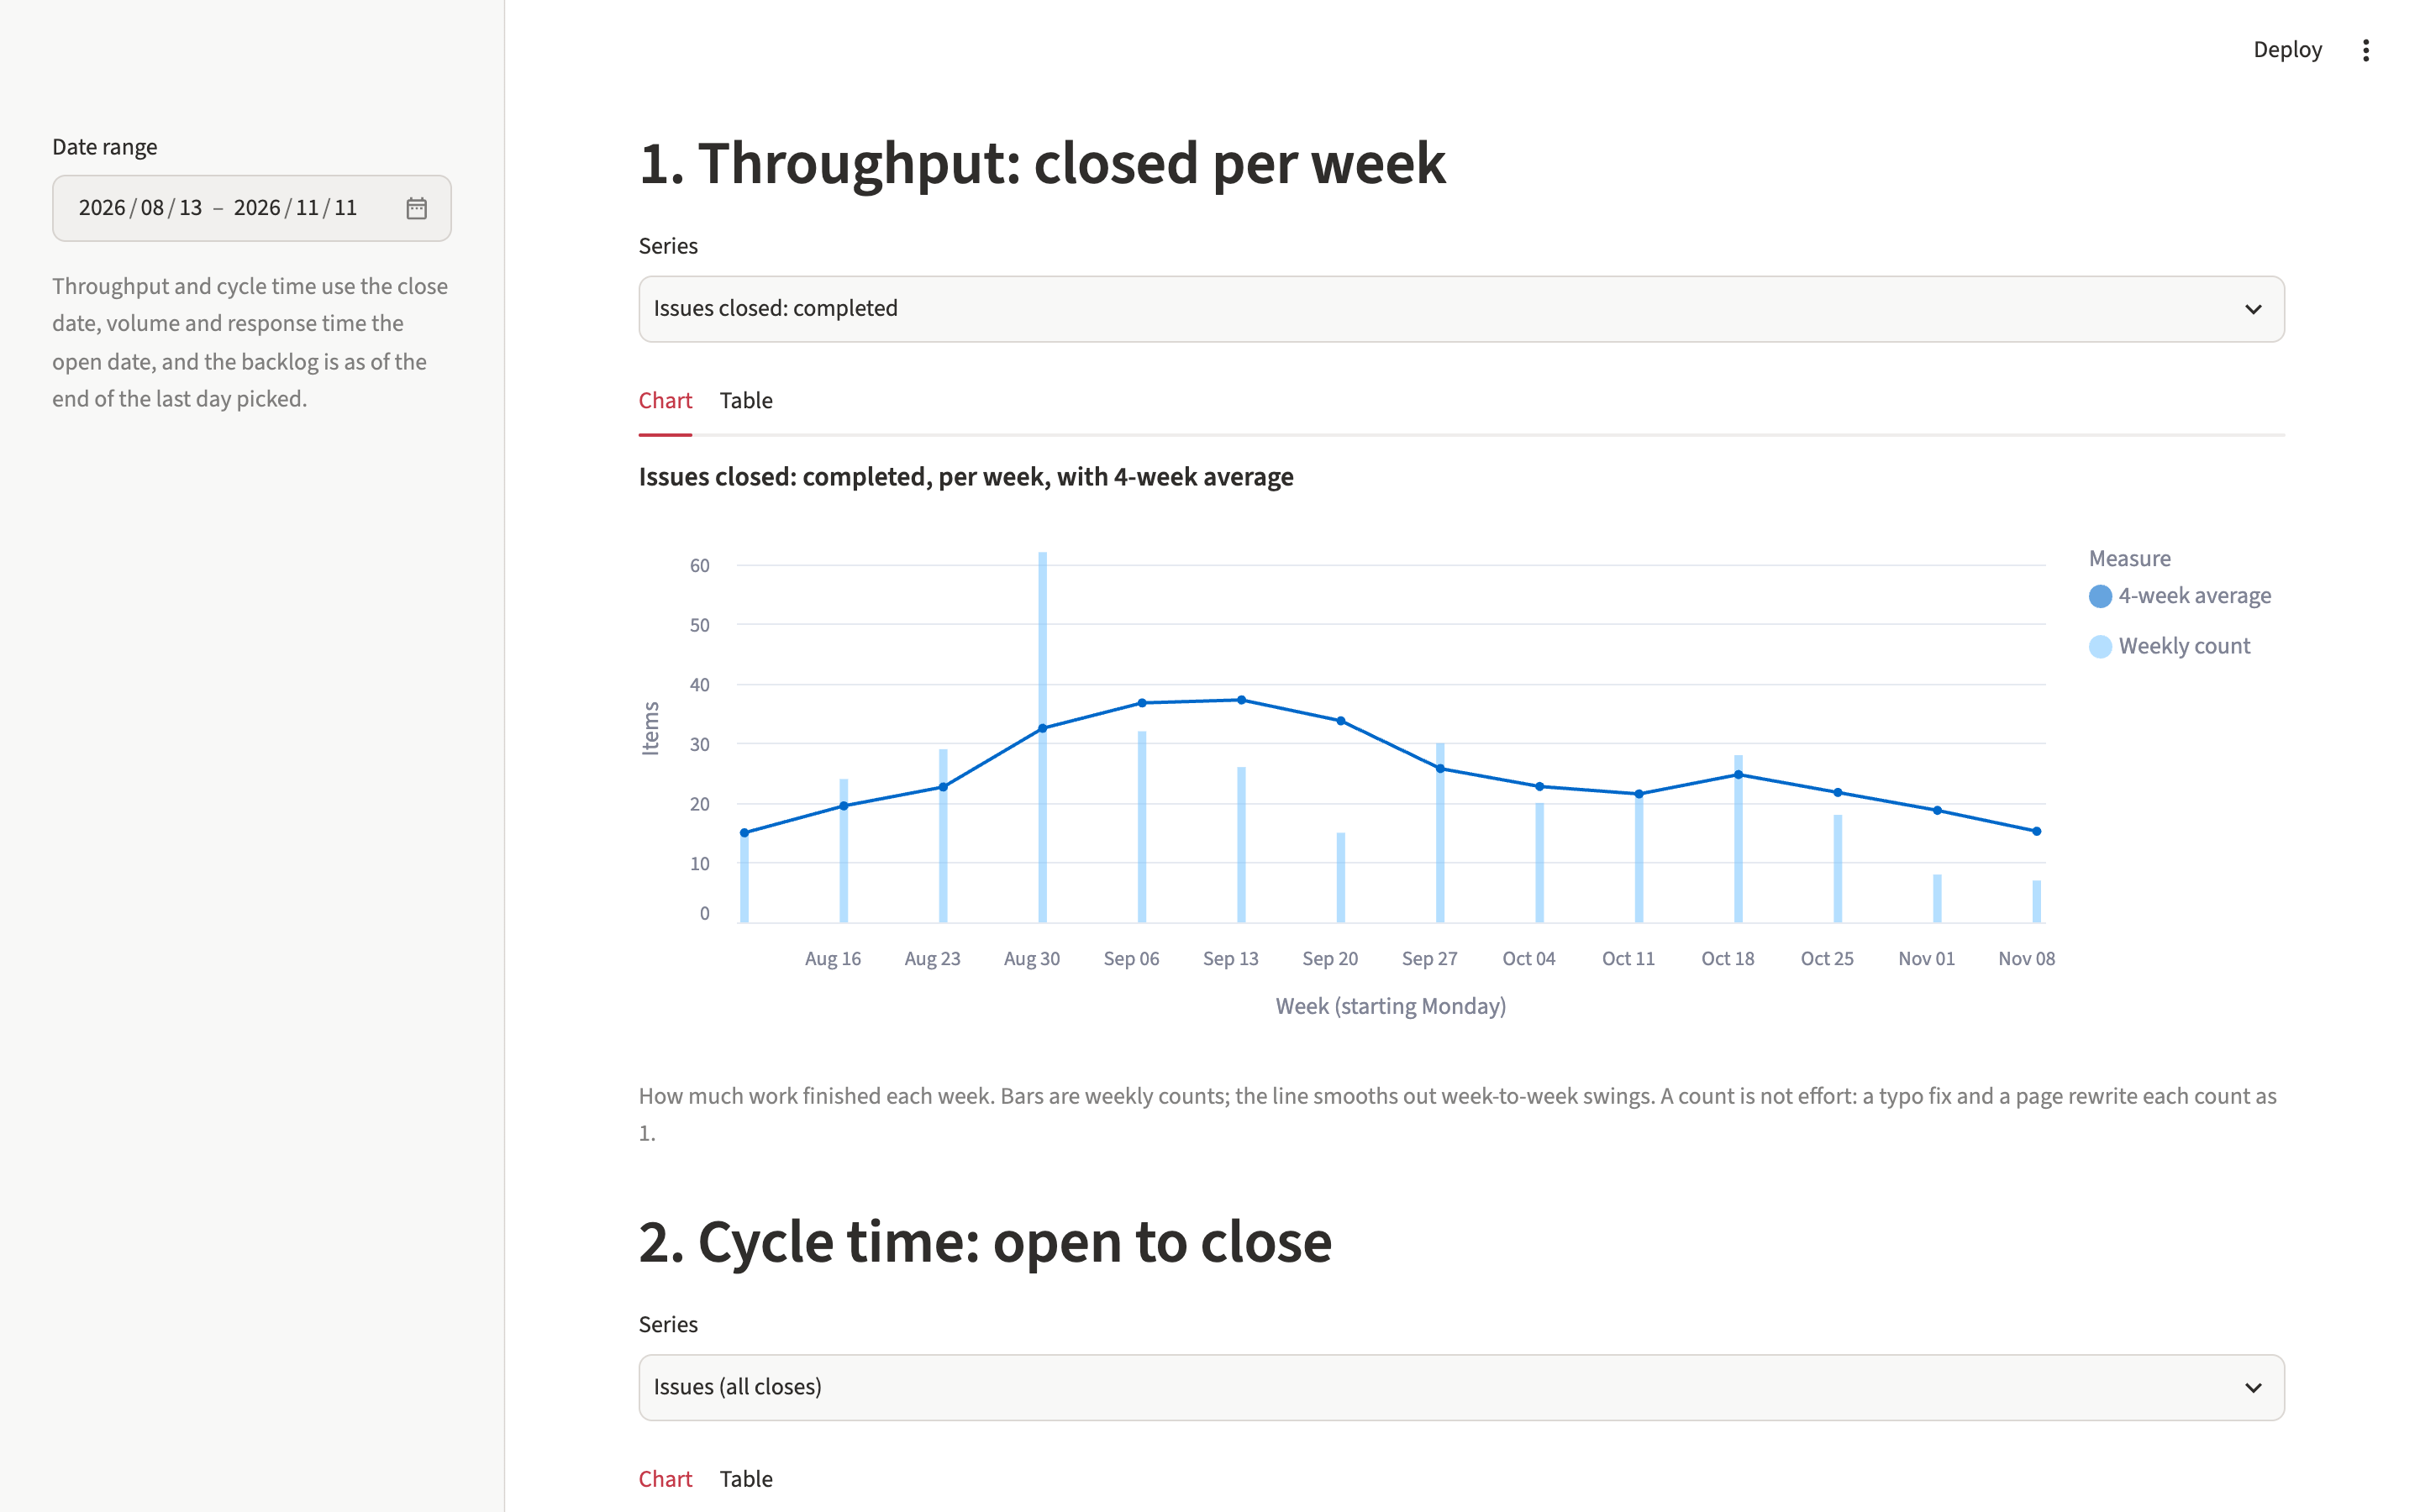
Bar chart of items closed per week with a line for the four-week average.
Throughput: items closed per week with a four-week average.
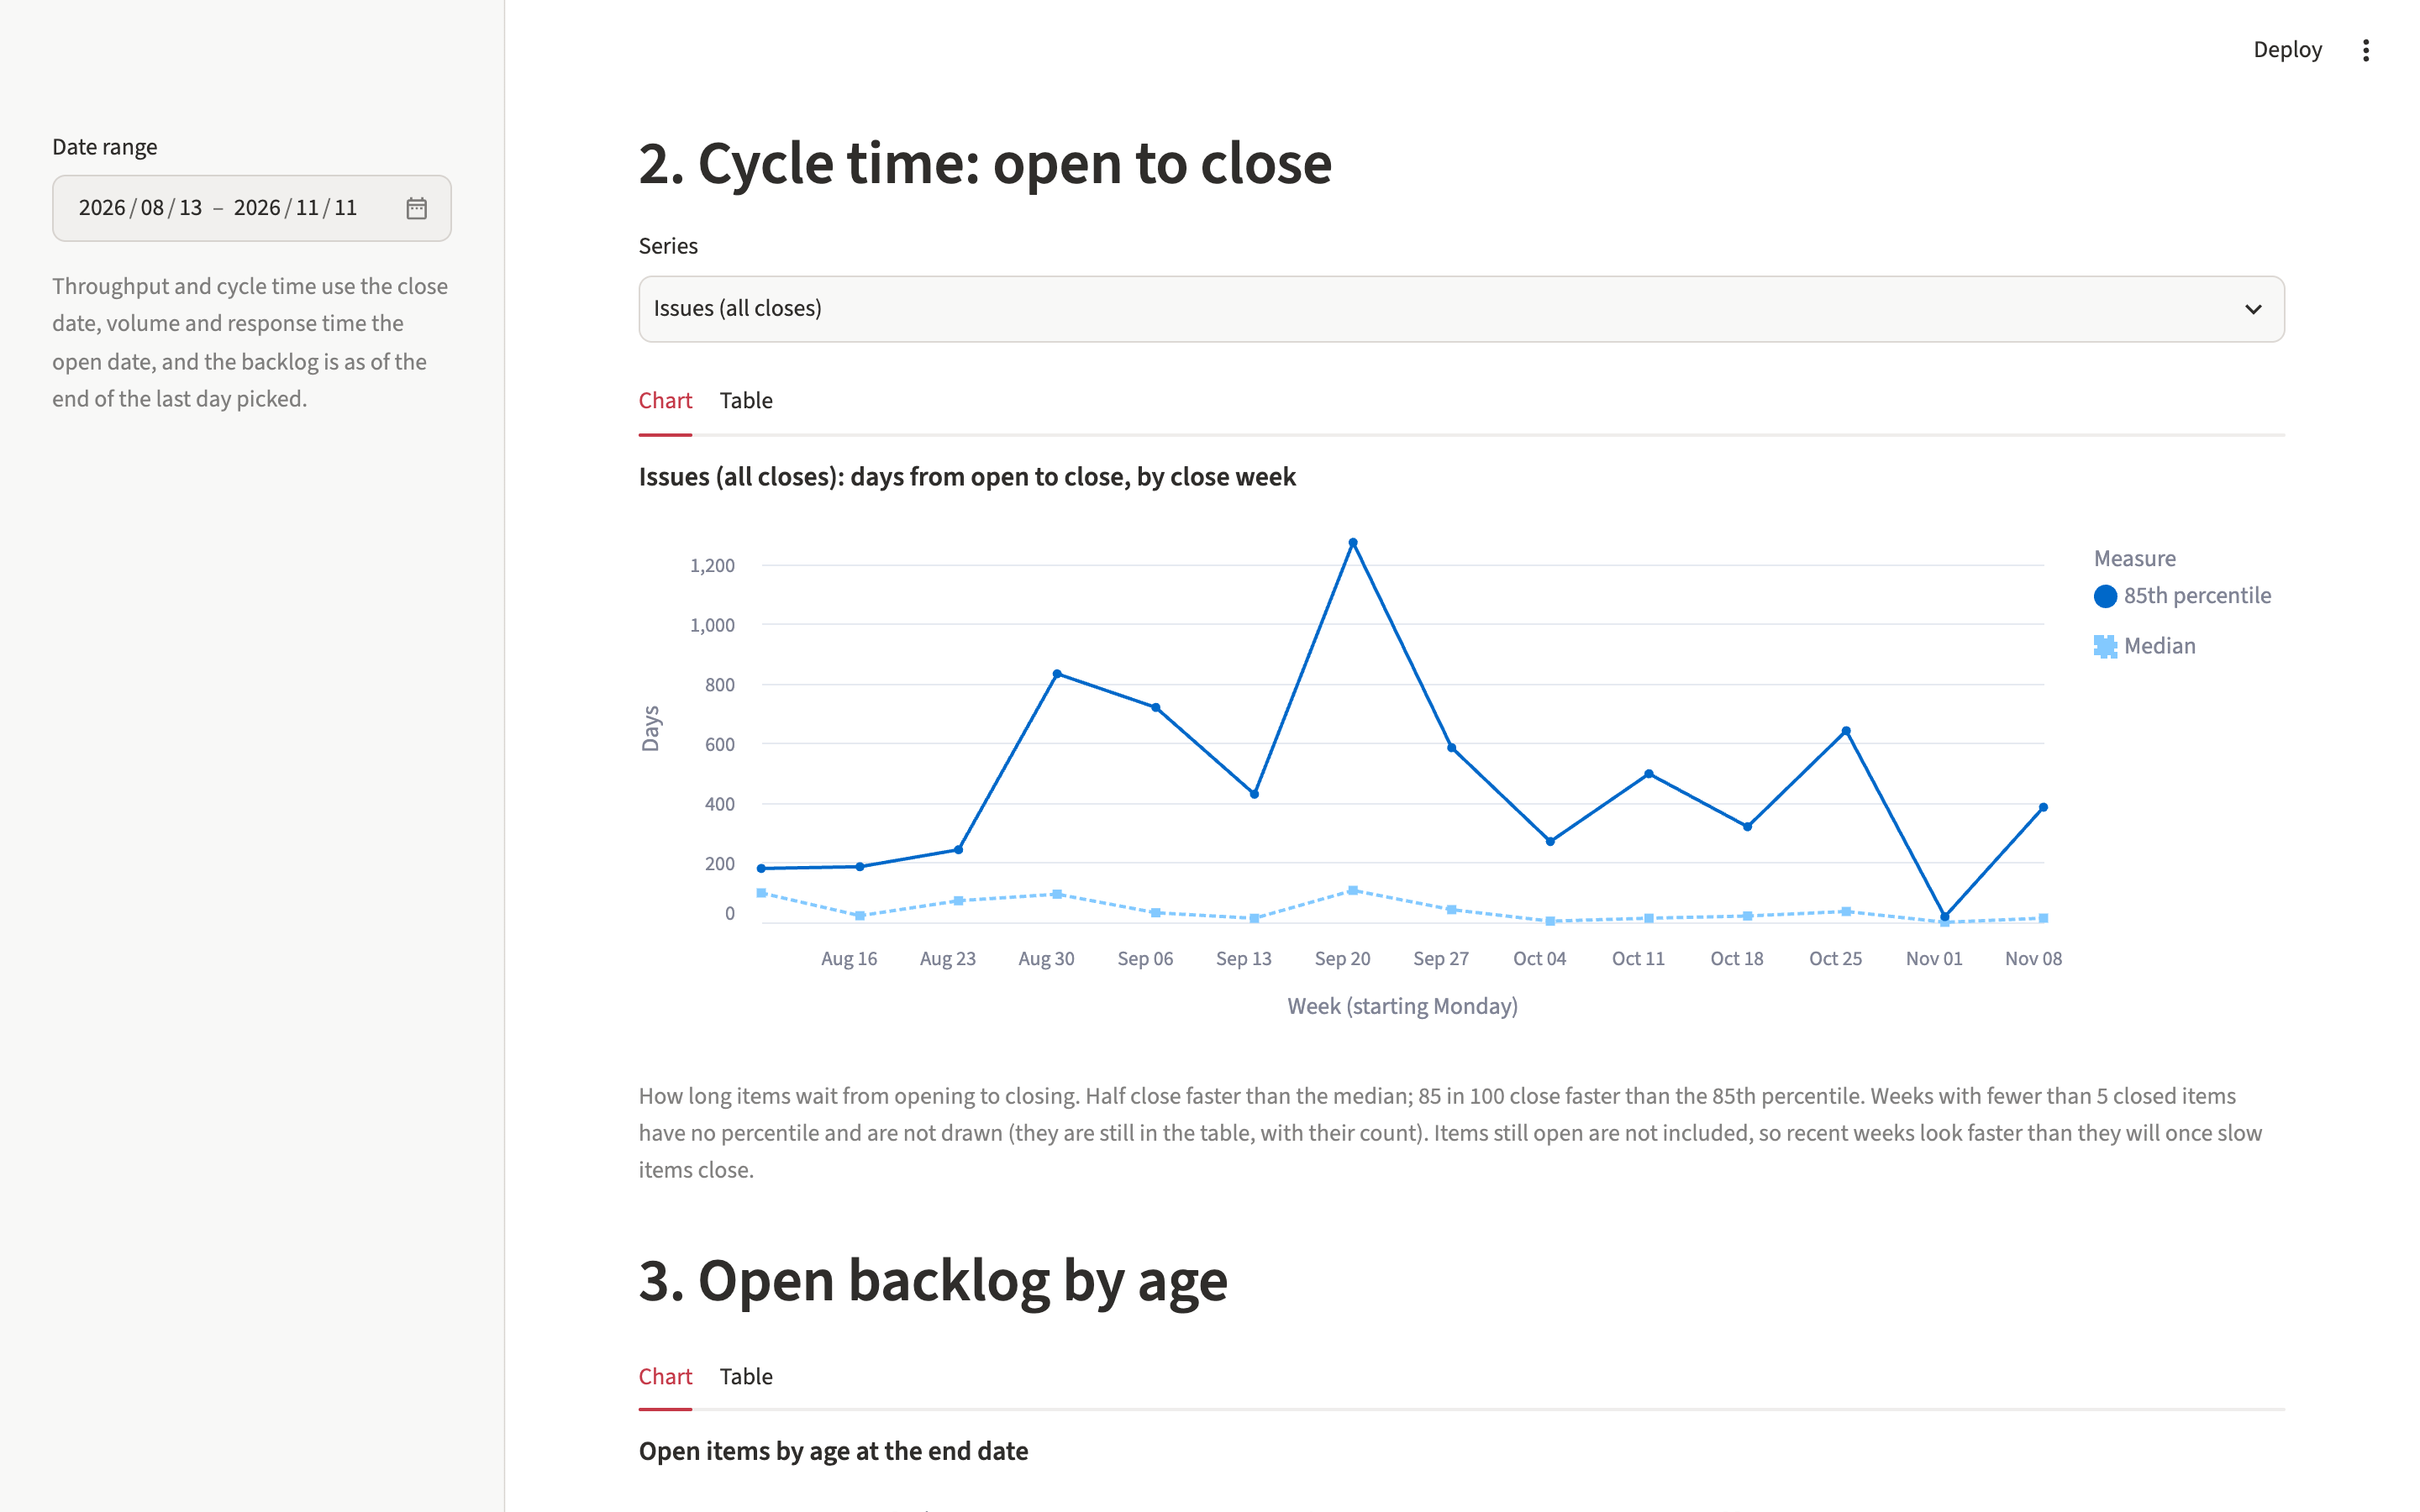
Line chart of days from open to close by week, showing the median and the 85th percentile.
Cycle time from open to close: the median and the 85th percentile.
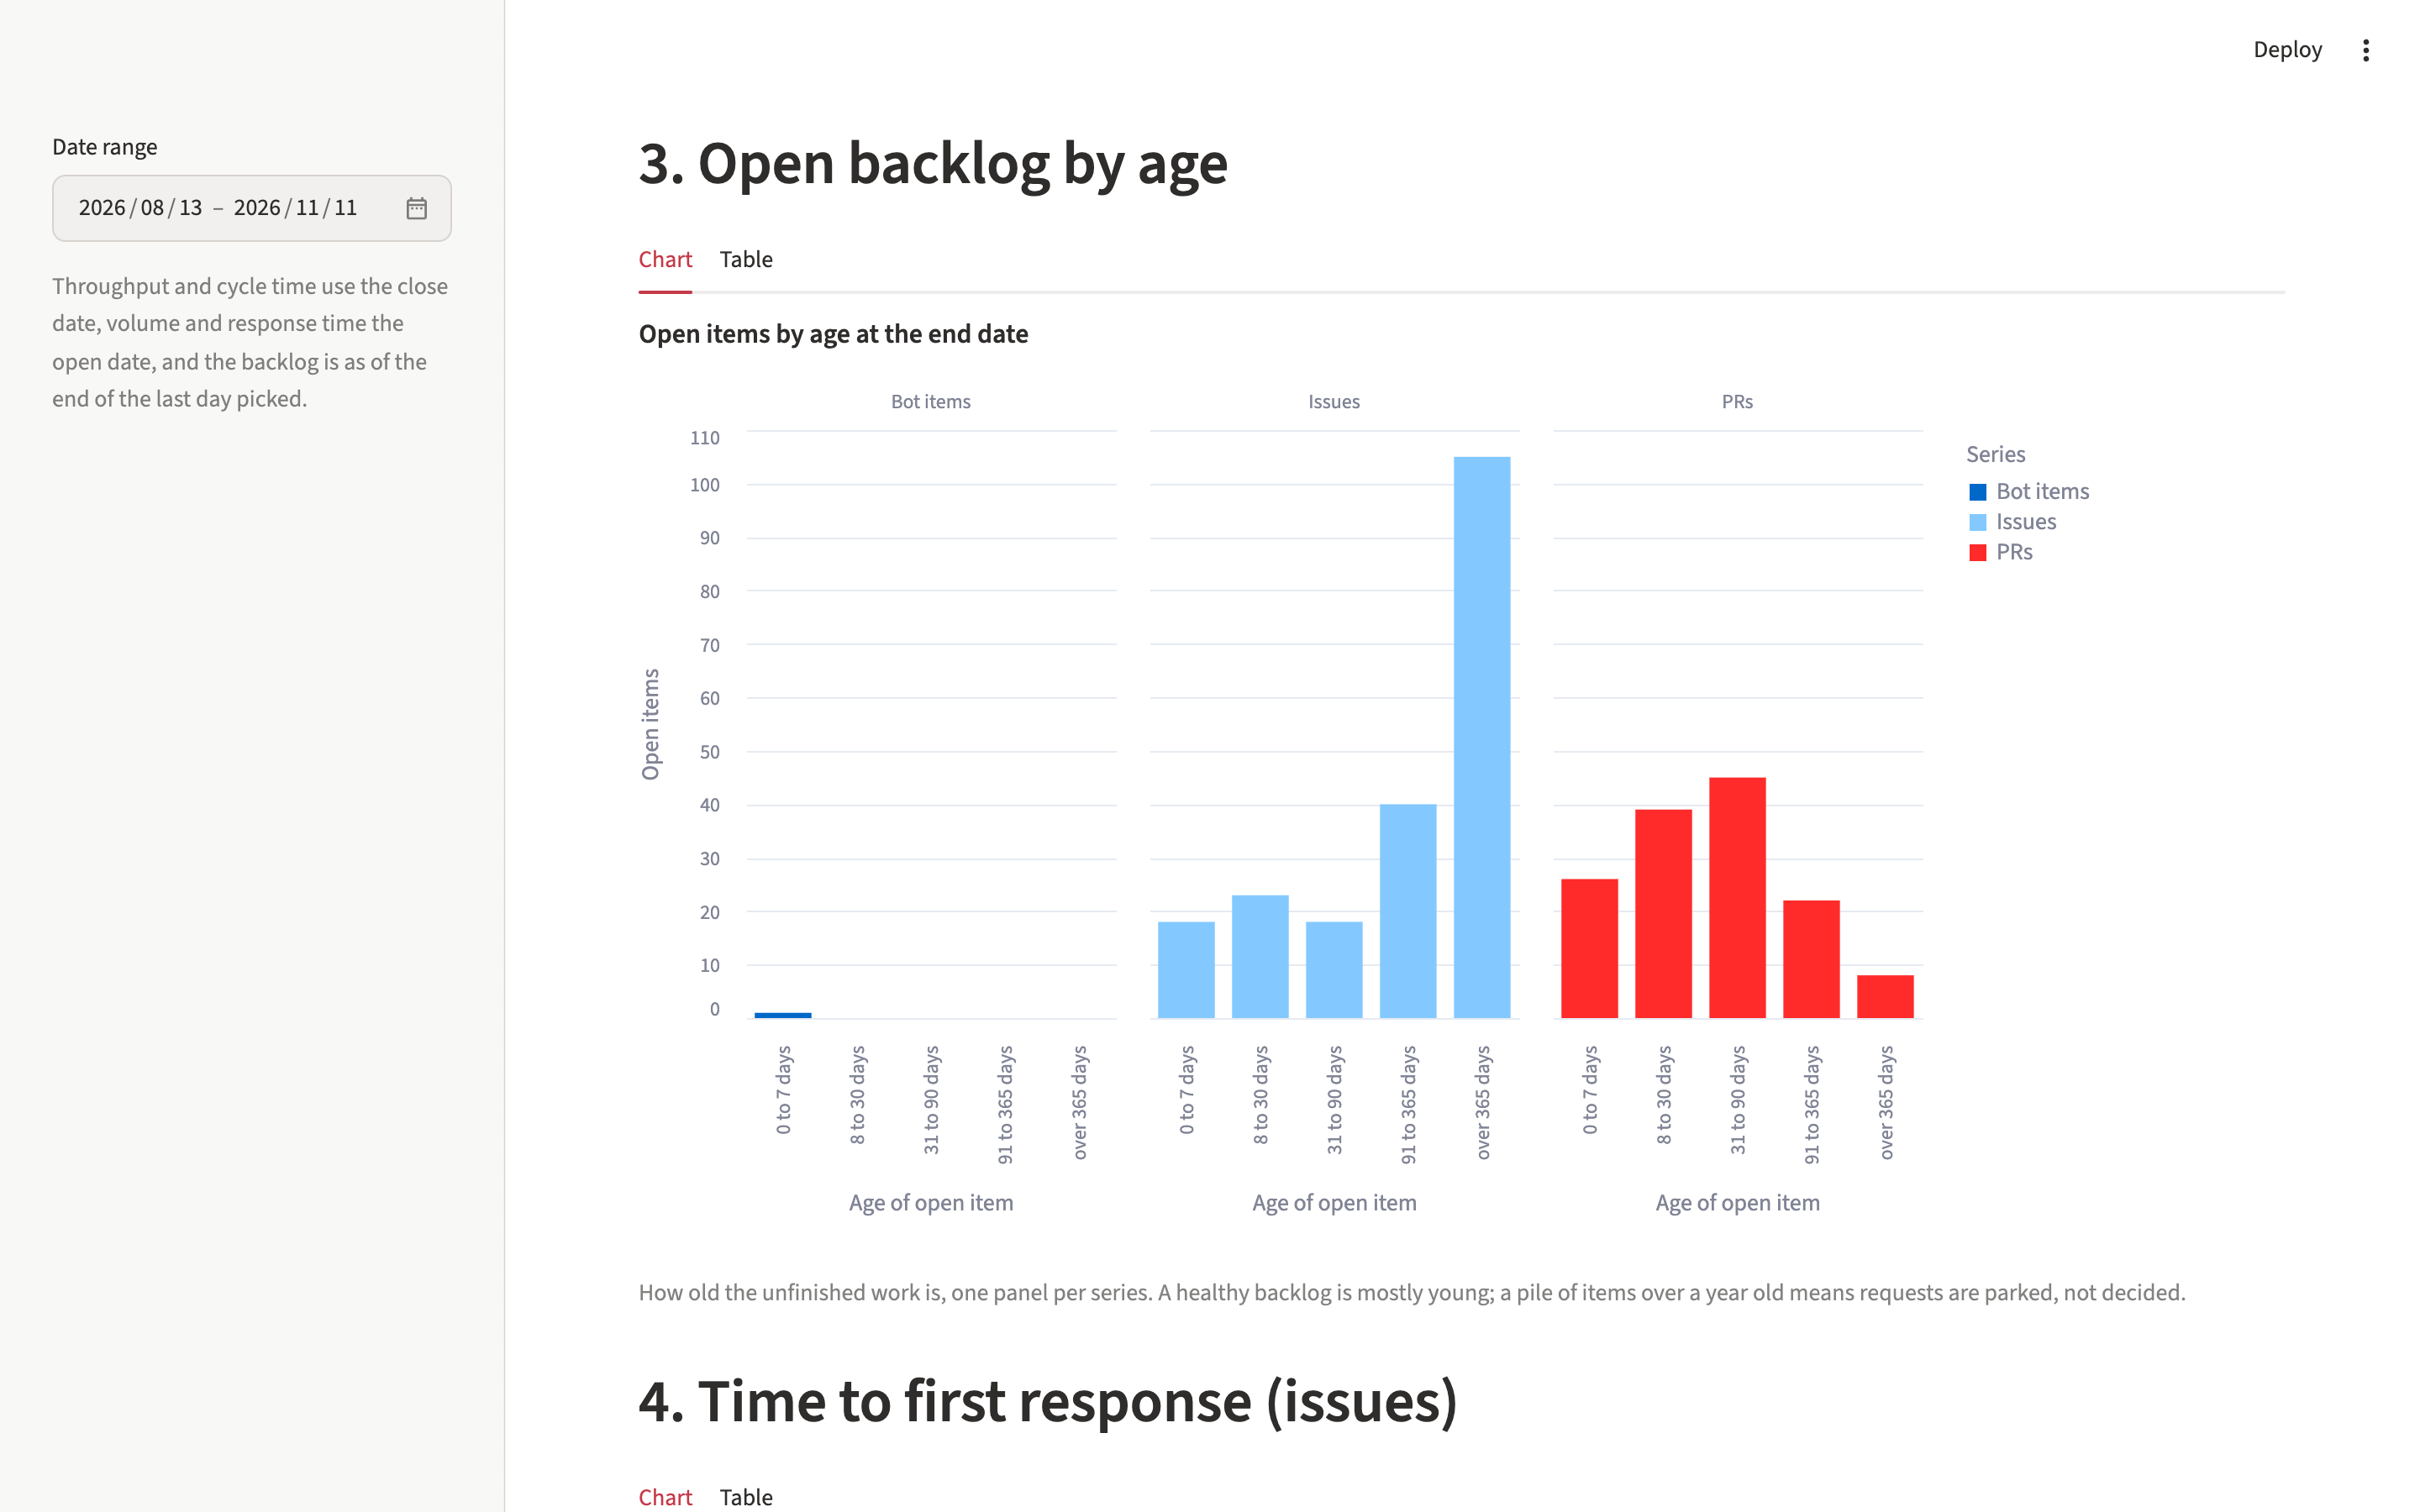
Bar chart of open items grouped by how long they have been open.
The open backlog grouped by age.
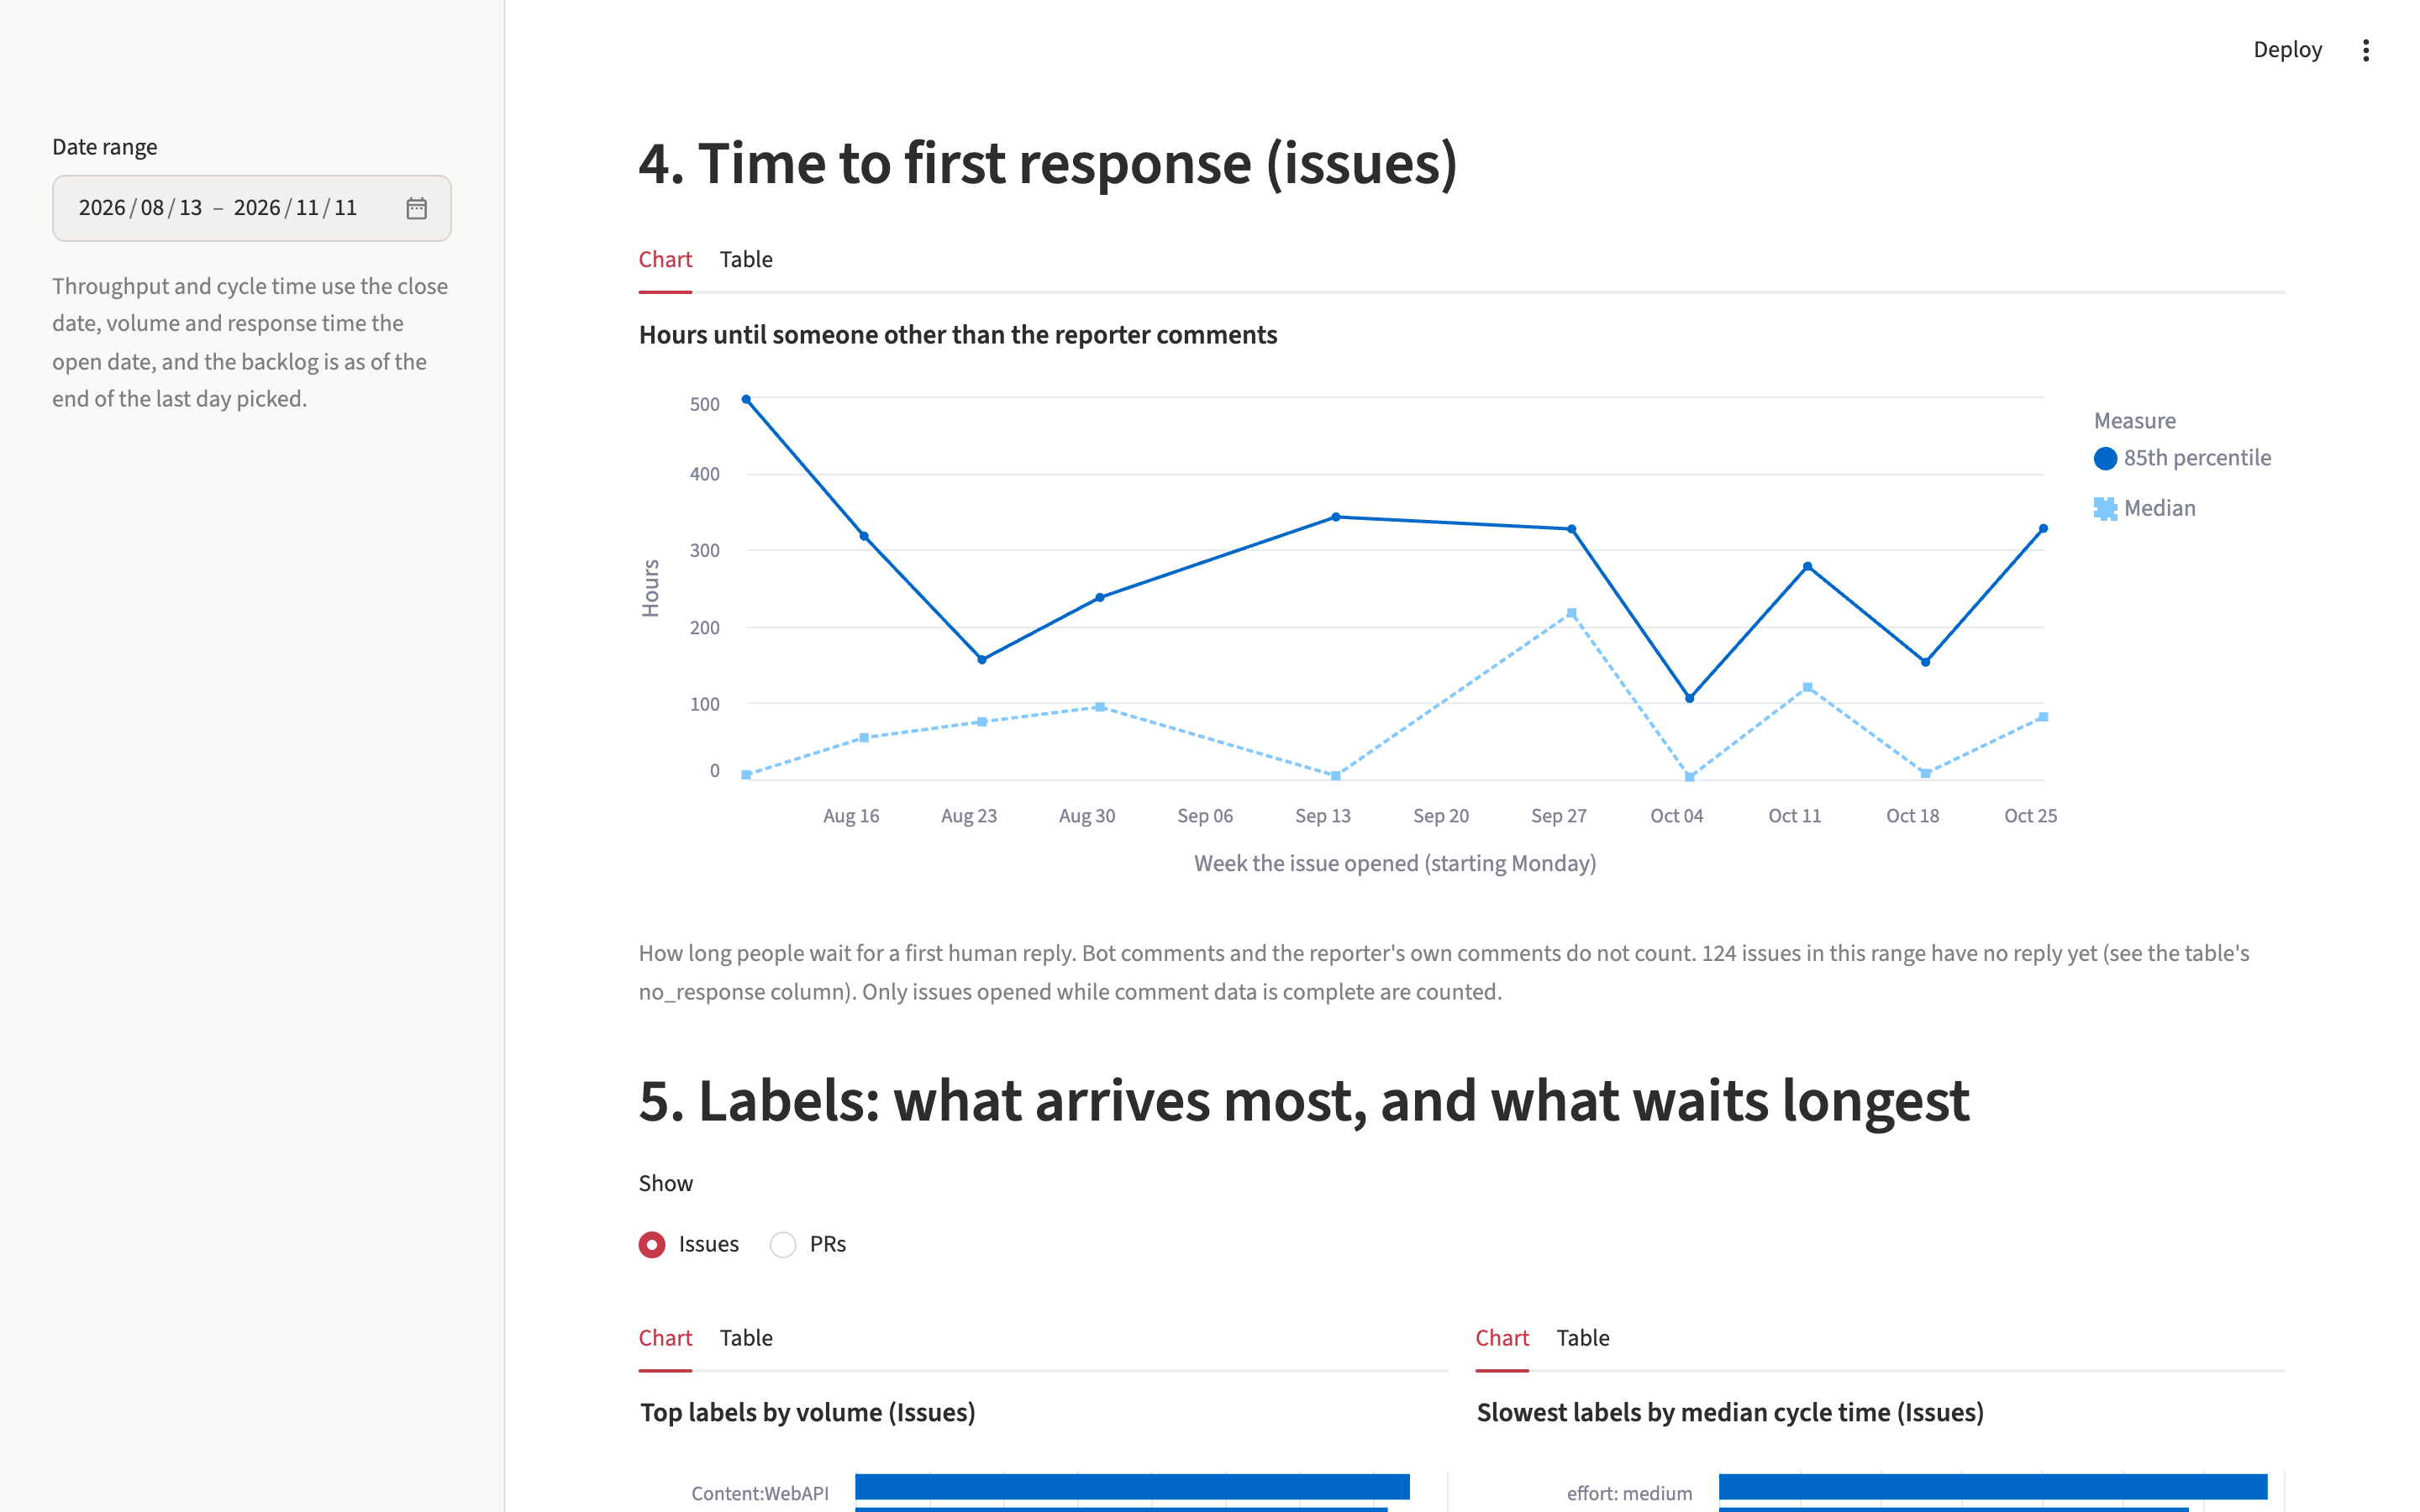
Line chart of hours until the first reply on an issue by week, showing the median and the 85th percentile.
Time to first response: hours until someone other than the reporter comments.
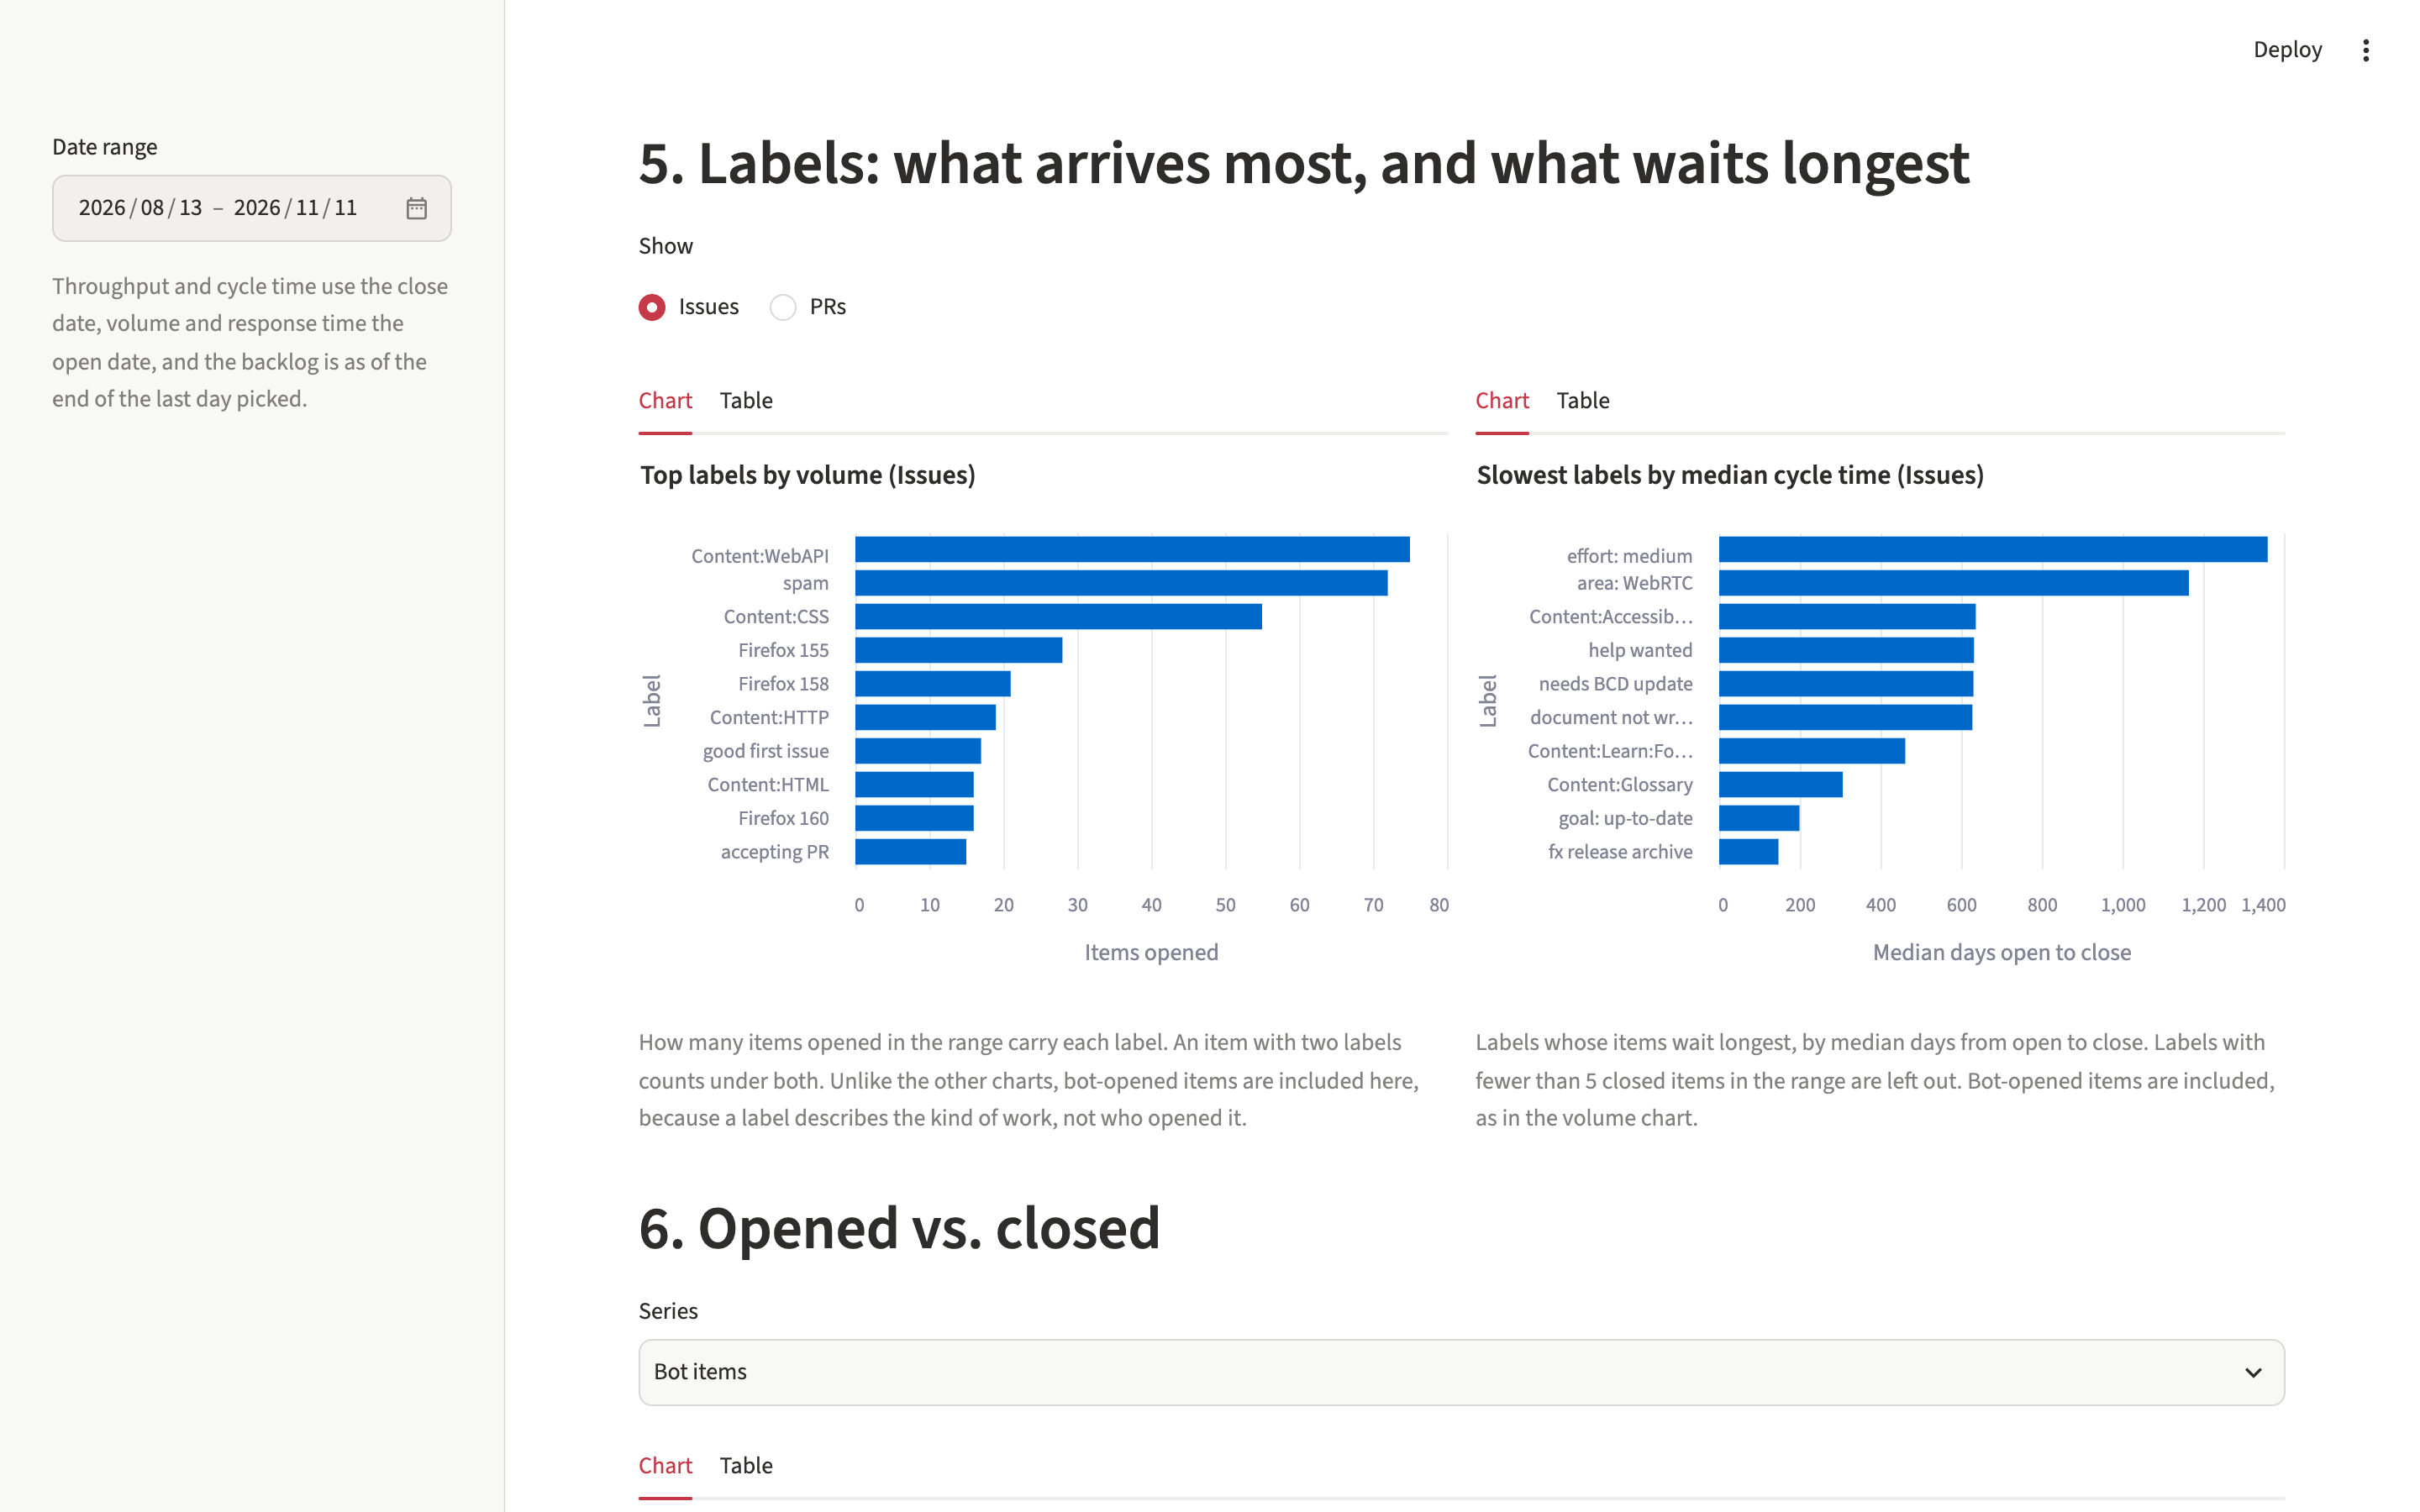
Two bar charts of labels: the most common by volume and the slowest by median cycle time.
Labels: which arrive most, and which wait longest.

Decisions

Which repository
mdn/content, over kubernetes/website and microsoft/vscode-docs. It is large, well known, and has active labels and triage.
Bots
Shown as their own series. The headline counts of issues and pull requests leave them out, so those numbers are people's work.
Time to first response
Measured from the repository-wide comment stream, not issue by issue. It gives the same answer for a small fraction of the API requests.
A correction to the data window
The first wording counted only items created inside the window. That dropped older items closed inside it, which would have understated throughput and cycle time. It was caught in review before any number was reported. The window now takes anything created, closed, or updated in it, plus everything still open.
Limits

  • A snapshot of 90 days, from 2026-08-13 to 2026-11-11. It is not live.
  • It measures activity on GitHub. It says nothing about how good the docs are or how many people read them.